Earth Watch
Create your solutions to the new 2014 challenges or build on one of the pre-selected solutions from 2013.
Filter Challenges:
By year:
By difficulty:
-
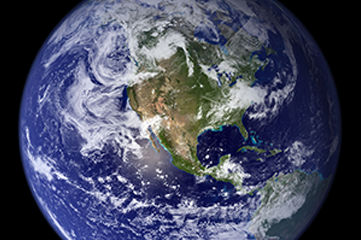
A Picture is Worth a Thousand Words
Import satellite imagery from NASA’s Global Imagery Browse Services (GIBS) to show how Earth has changed in the last two years
-
AirNow International Transport App (ANITA)
Create an app that shows how large-scale international air quality events relate to daily Air Quality Index (AQI) data.
-
Animate Your World
Unlock the power of NASA’s Earth imagery and build something spectacular! NASA maintains and contributes to a collection of hundreds of terabytes of Earth observation imagery from our numerous satellites, which is available to scientists and the public.
-
Climate and My Neighborhood
This challenge focuses on the creation of a visualization interface (mobile app or a web app accessible on a mobile platform) that would allow location-specific access to climate data sets using coordinates specified by the user.
-
Coastal Inundation in Your Community
Your challenge is to create tools and provide information so communities can prepare for coastal inundation.
-
Community Visions of Climate Adaptation
Create an app, web interactive, map, 3D model, or visualization for actionable community plans about climate adaptation to better enable communities to prepare for weather and climate patterns.
-
Cool it!
This challenge is about bringing together hardware builders, coders, engineers, social scientists, teachers, and community members. Create a sensor kit to measure temperature and relative humidity in several locations in real time.
-
Earth As Art
Over the decades, Earth-observing environmental satellites have provided invaluable information and beautiful images of the Earth from the vantage point of space. The challenge is to create a way for people to find beautiful images in the Earth-observing
-
Earth Images From Space Station
Create an app that locates publically available Space Station images of Earth and presents them on a 2- or 3-dimensional map. Viewers can comment, vote, download, and share the images.
-
Earth Observation Visualization
Combine the wealth of data about conditions on Earth with the technology to display that information on a globe. Design a way to visualize live Earth observation data on a web app or a mobile app.
-
Gravity Map
Create an app that displays the gravity force for any location on Earth. Grab data about gravity around the world on a gravity map, or geoid, and use positioning data to show gravity at any location.
-
Image-ine Earth Yesterday and Today
What would you build if you had instantaneous imagery data of the Earth from the past decade?
-
Leaf Me Alone
One way to see the effects of air pollution is to evaluate the damage to leaves and plants. Develop a tool to quantify and classify the amount of injury to the leaves of ozone-sensitive plants.
-
My Sky Color
Classifying the sky’s color is one way to indicate the level of aerosol loading in the atmosphere. Create a tool that lets people record the color of the sky using consistent and qualitative standards.
-
Print My Watershed
Create a 3D model of a watershed (also called a drainage basin) so you can see rivers, streams, and different kinds of land cover like forests, farms, and impermeable surfaces.
-
Take the Earth On a Hike: Offline Access To Remote Sensing Data
Satellites put a ton of data in your hands, but it's hard to access without an Internet connection. Design an app that enables downloads of this data for use in the field.
-
Track That Wetland
Create an app that allows citizen scientists to observe plant communities within and outside of wetlands and delineate their boundaries, and evaluate wetlands to validate or calibrate satellite data.
-
Track a Landslide
Landslides occur all over the world, causing many fatalities, destroying livelihoods, and causing extensive economic damage. Create a way to inform people before landslides occur or to help people recover after a landslide.
-
Tree Factor
The U.S. Forest Service has developed allometric models that use input about trees to compute ecosystem service values – but these need basic ground-based input about the trees.
-
Where on Earth
Create a game or app that displays satellite images of places around the world and asks users to guess where and what they are.
-
NASA Greener Cities Project
The Greener City project crowd-sources the collection of microclimate data through low-cost sensors, network connectivity, and urban gardens.
-
OpenTiles
OpenTiles is an online service which provides GIS scientists and enthusiasts access to a plethora of satellite observations.
-
aquaping
Our mobile app, aquaping, attends the need for consulting, providing, and sharing information about contaminated water sources at a specific location both among individual users and interested organizations.