glass-earth
This project is solving the A Picture is Worth a Thousand Words challenge. Description
Challenge
Glass Earth is solving the challenge “A Picture Is Worth A Thousand Words” whose requirement is creating a “mashup” to combine data from various sources including satellite imagery from NASA’s Global Imagery Browse Services (GIBS) and other reliable sources, finding the connection among them. Combining information like this can put data into context to tell a compelling story or unearth an interesting insight.
The idea
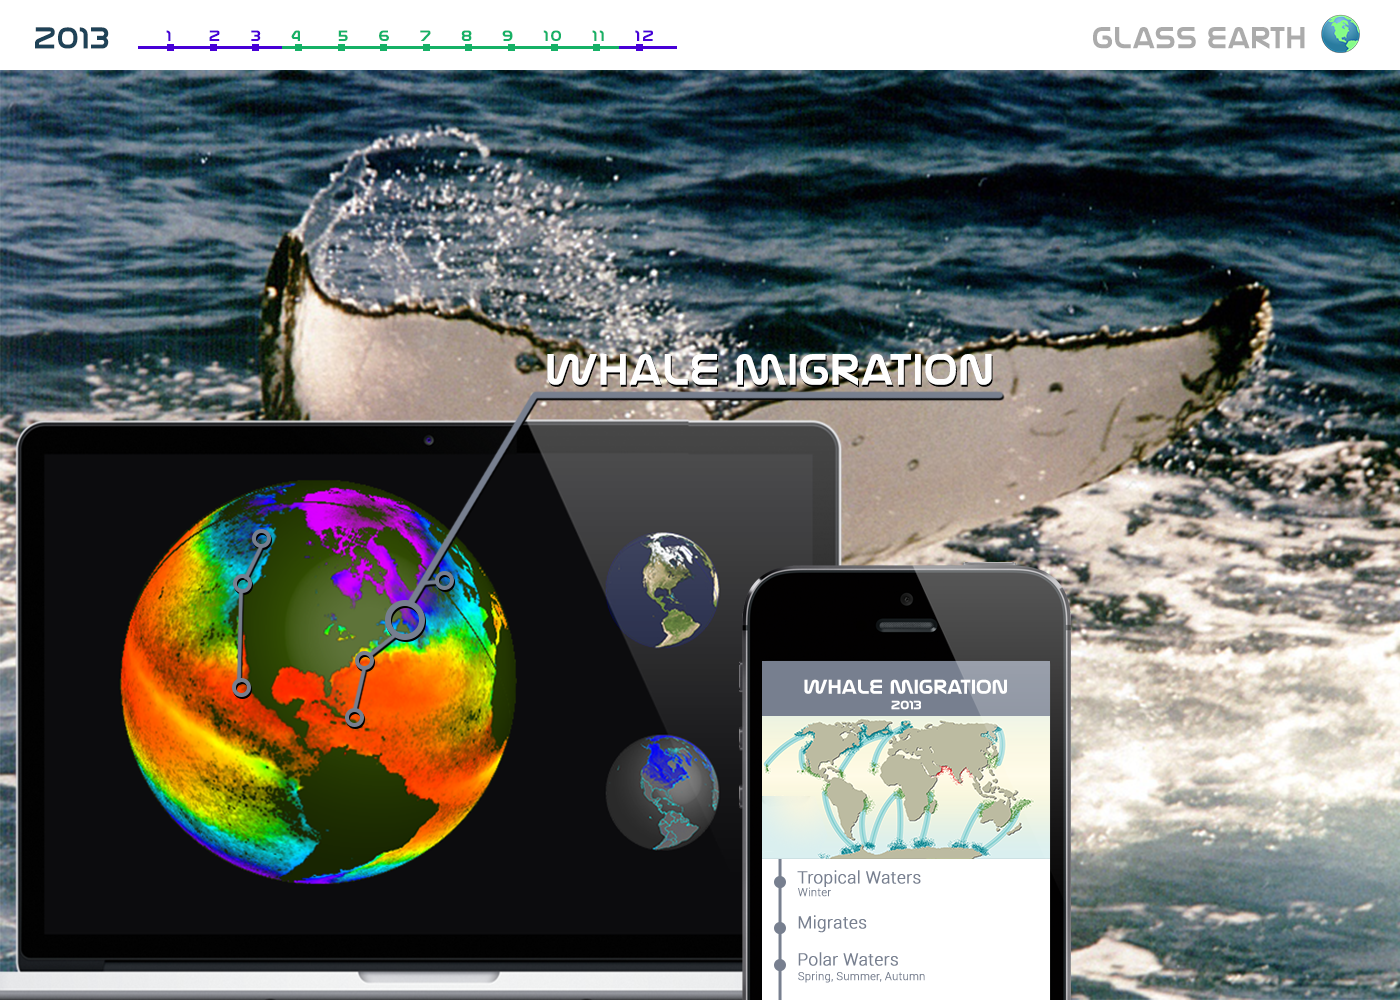
We combine and transfer data from NASA to the public, especially to pupils/students in an interesting, friendly and meaningful way. A graph from satellite illustrating land temperature may have little meaning. But when we want to study about a wildfire, the graph will be helpful for us that to understand the relationship between changes in temperature and the wildfire. Similarly, a graph presenting ocean surface temperature is just numbers and images. If it is combined with tracks of migratory whales, the graph become very useful information to examine their migratory behaviors. By presenting the Earth on a 3D hologram inside a prism and by combining with pictures, videos & information come from variety sources, we create a new experience in studying Geography, promoting students’ ability to absorb the lessons.
We imagine the world in near future where "smart"-things will be connected together to provide useful information and better experience for users
Our solution
Our solution is to illustrate the Earth and various kinds of graph on a 3D hologram controlled by handy motion.
The system includes:
1) 3D hologram for displaying the Earth and graphs
2) Motion Tracker for tracking hand gesture to control the system (leapmotion.com)
3) Controlling Tablet for teachers to display information and control graphs
4) Web App for students to access to the lessons
5) NFC (Near-field communication) for teachers/speakers to choose lessons and for students/audiences to have a quick access to the lessons/presentations
6) Central Server for connecting these above-mentioned devices
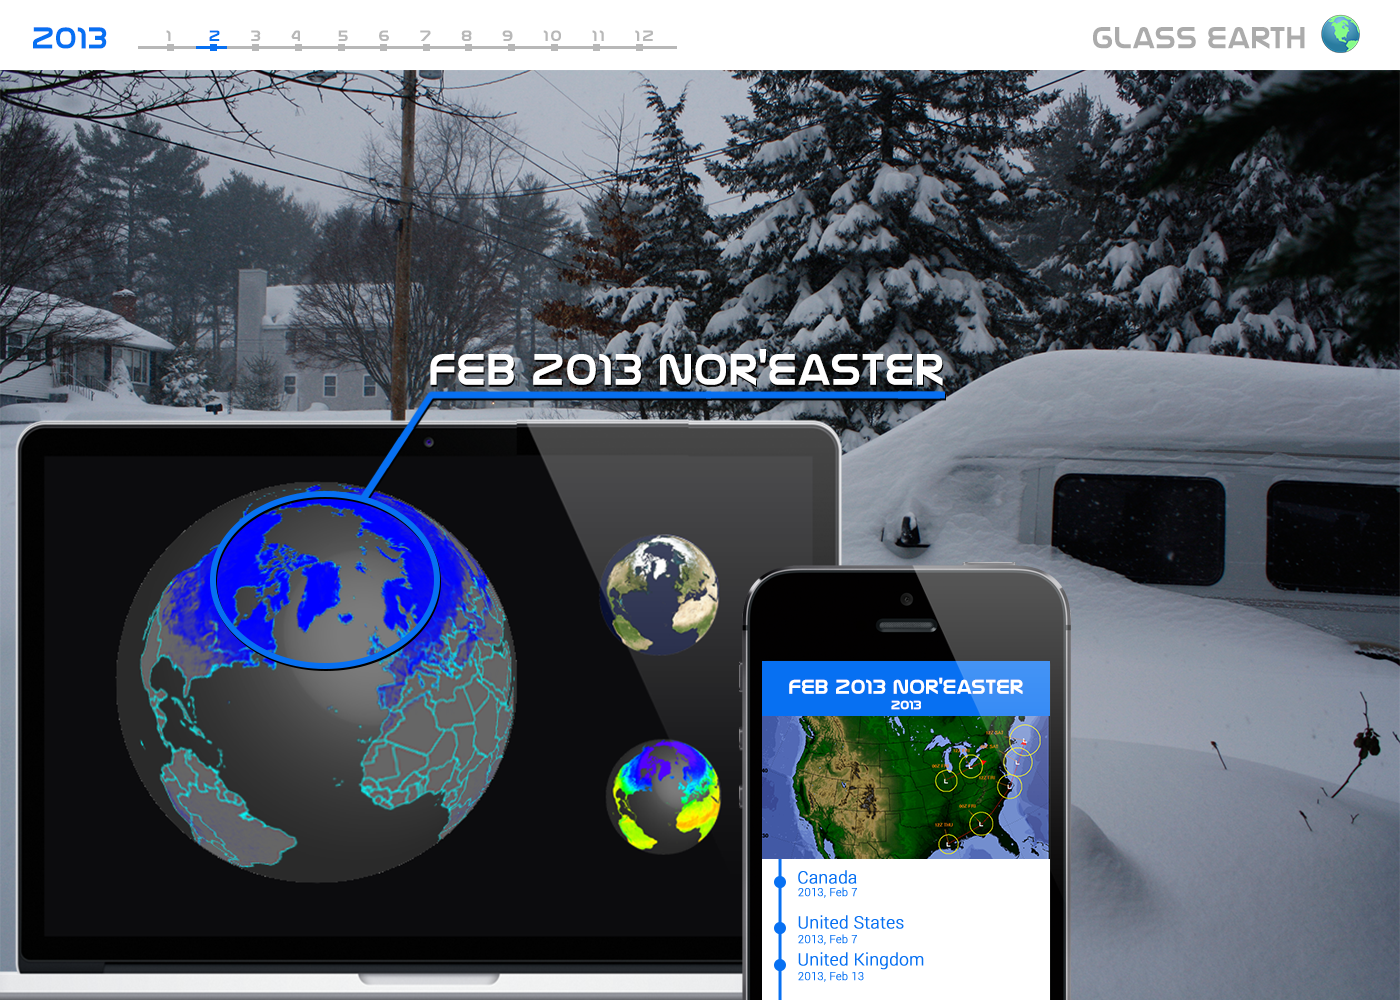
Our product creates stories in the form of lessons to present relationships between weather elements, between data from satellites and images on the Earth surface, such as wildfire and temperature/rainfall, whale migration and ocean surface temperature, nor’easter and temperature/snow cover, etc. Teachers/speakers can choose what story they want to present by using the NFC. Students then can observe the graph displaying the changes of weather elements on the 3D globe, interacting with the globe by hand gesture without touching the keyboard as usual. They can also see detailed information including content, images, video, etc. on their own mobile device by tapping it on the NFC or scanning QR code.
The system can be used in schools or museums for teachers, students or any others to study about environment in a lively, interesting way, inspiring them to discuss and explore. This consequently nurture and develop their love for the environment and the Earth.
Usage in Geography class
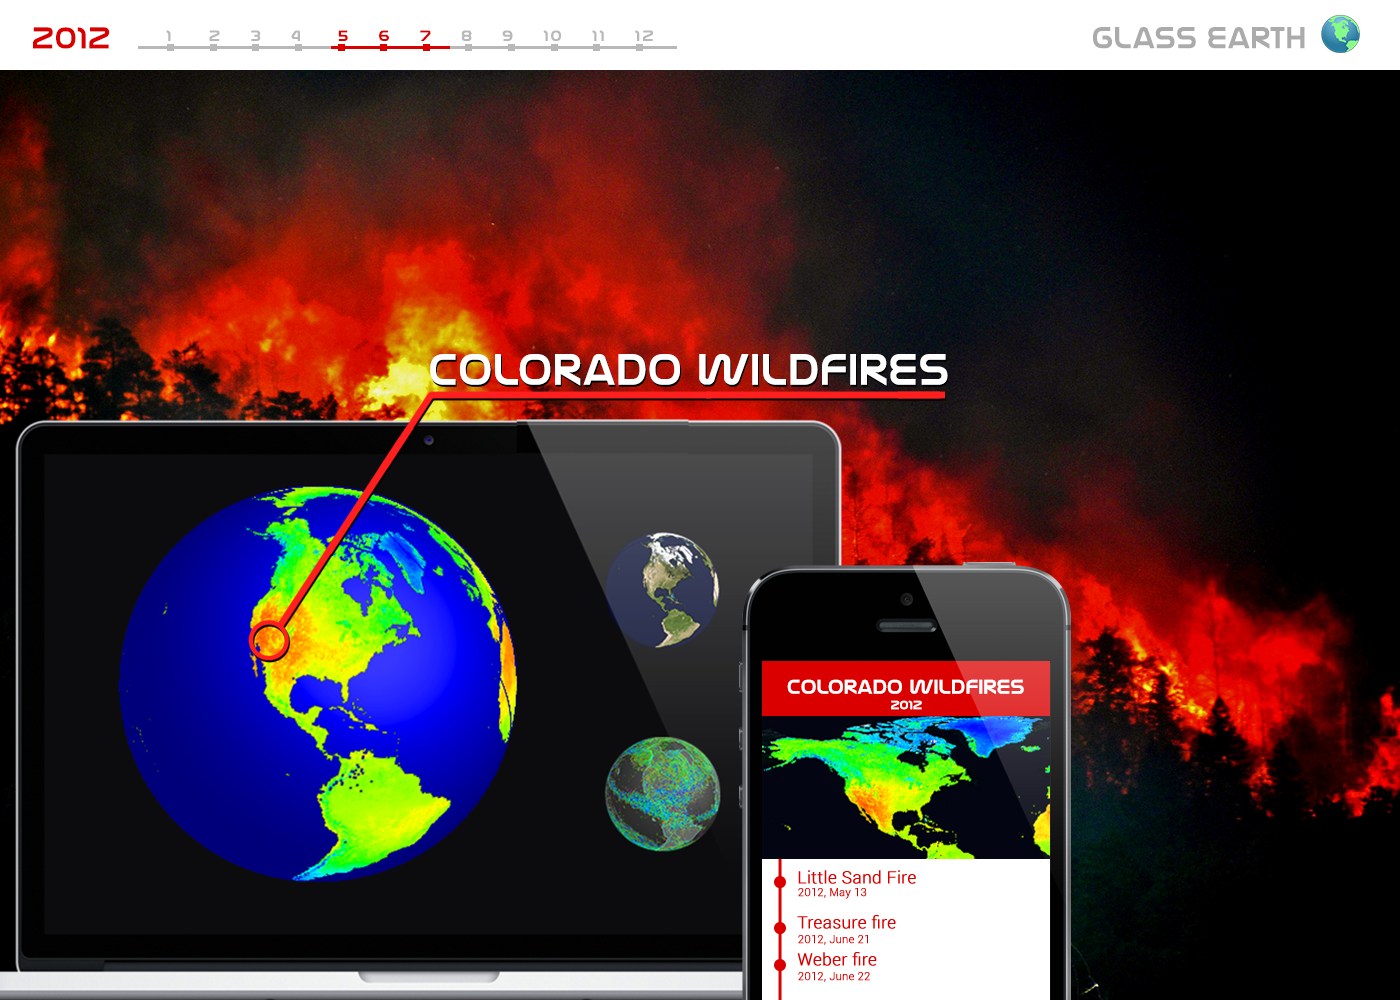
Imagine that you are entering a Geography class in the near future when interactive technology becomes popular. The lesson today is about the wildfire in Colorado. The light is switched darker and students are gathering around a 3D globe in the center of the class. To begin, the teacher uses a tag to activate the lesson’s content. The 3D globe displays the image of the Earth in May, June and July 2012 and the wildfire scope in Colorado is zoned. Students use their mobile phone to observe images, videos, data and other information about the wildfire. Teacher then waves her hands to change to the graph about temperature in the same period of time. Students observe the red zone on the graph and comment that the continuous high temperature and dry weather make the fire broke out and spread quickly. Teacher adds more information and switches to the graph of precipitation. The lesson finishes in joy and excitement.
Sample lessons
Here are some sample lessons we created for demonstration.
Glass Earth’s Data
The daily images from NASA’s satellites don’t cover all Earth surface due to the satellites’ orbit. We combine data of a period of time together to make a full graph covering all Earth surface, suitable for displaying on the 3D globe and for noise filtering. The period of time depends on the kind of graphs. For example, data for land temperature graph are combined once for 5 days. You can get these resources via our API.
Our API documentation can be found at http://spaceapps.glassearth.net/wmapi
Glass Earth’s Future
We are so excited with our Glass Earth solution. The first version of the Glass Earth is here, but we have big plans for the future. We will complete some lessons that we’ve already processed data, such as bird migration, population allocation, ice smelting, storm, air pollution (dust, smoke), etc. We will also continue to develop the system to combine other kinds of data and update the new data from NASA periodically to provide a wider range of lessons. Besides, creating an online platform for people to access to the system and submit their lessons/stories is also one of our plans. Anyone around the world can easily join online classes globally. We strongly believe this user friendly approach can be soon applied in the reality.
Third Party Materials
- NASA’s Global Imagery Browse Services (GIBS)
- ABC News about Colorado Wildfires 2012
- Humpback Whale Migration by Riccardo Pravettoni, UNEP/GRID-Arendal
- WPC LPA Forecast Feb 07, 2013
- Trees torching - High Park Wildfire
- Buckelwal Schwanzflosse by Rainer J. Wagner
- Winter Blizzard 2013 ,Billerica MA
Project Information
License: MIT license (MIT)
Source Code/Project URL: https://github.com/glass-earth/glass-earth
Resources
Video - https://www.youtube.com/watch?v=QeqrtSaIRg0
Sample Lesson: Colorado Wildfires - http://spaceapps.glassearth.net/lesson/colorado-wildfires
Sample Lesson: Whale Migration - http://spaceapps.glassearth.net/lesson/whale-migration
Web App Demo (for student) - http://spaceapps.glassearth.net/app
Android Controller Demo (for teacher) - http://spaceapps.glassearth.net/controller
Unity Demo (for projector) - http://spaceapps.glassearth.net/unity
Glass Earth website - http://spaceapps.glassearth.net/
The Event at Ho Chi Minh City - http://tuoitrenews.vn/business/19332/three-vietnamese-teams-picked-for-nasa-hackathon-competition


